
After two posts about spending, specifically spending for joy, I’m back to my regularly scheduled programming: Save, Invest, Repeat.
Today, we talk about stock market ‘averages’.
Stocks, also known as equities, are the growth engines of investment portfolios.
The S&P 500 is a group of stocks from the 500 largest publicly traded companies in the United States. It includes companies you’ve surely heard of such as Apple, Amazon, Tesla, and Berkshire Hathaway (aka Warren Buffett).
It also includes companies you’ve likely never heard of such as Cummins, Inc. a company that makes “diesel, natural gas, electric and hybrid powertrains and powertrain-related components” and Tyler Technologies a company that makes “software and services designed for government and schools.”
When you buy an S&P 500 Index fund, you are buying a tiny sliver of all 500 companies. It’s a marvelous age we live in when anyone with a few dollars can do this!
You can peruse the entire list of companies on the S&P 500 index here.
The list is not static, it is regularly ‘reconstituted’. Companies fall off the index and new ones are added. To learn more about the index, check out this terrific article at Investopedia.
So far in 2023 this group of stocks has been doing well! According to Marketwatch, the S&P 500 index is UP 18.63% year-to-date. (as of 7/18/23)
Last year, in 2022, the index was DOWN 18.1%
This chart, from Dimensional*, a mutual fund company I use to invest mine and my clients’ money, shows the average yearly return of the S&P 500 Index yearly since 1926.
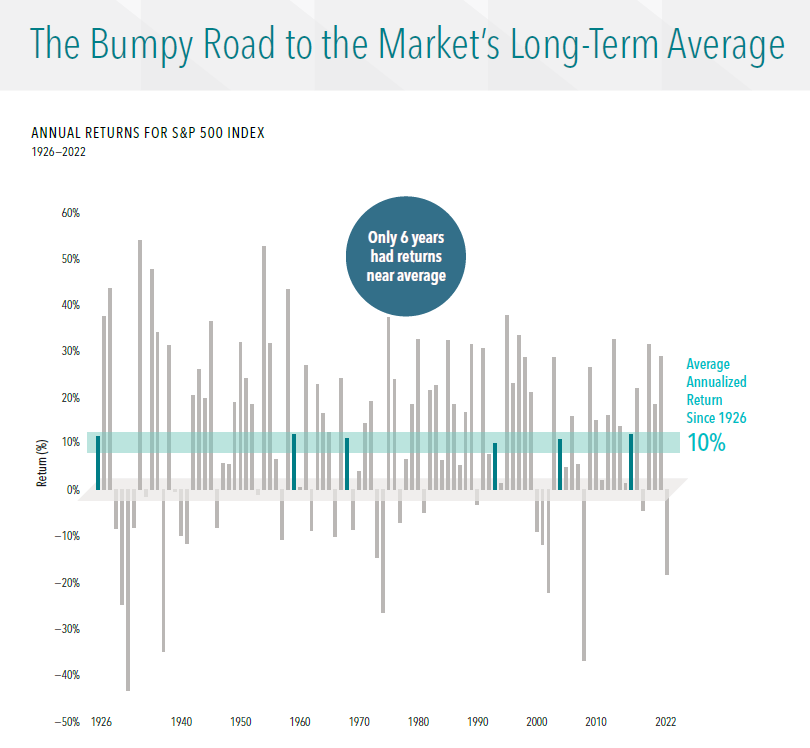
Each bar represents one year. Annual returns have been positive 71 times and negative 26 times.
The “average” return of the index since 1926 has been about 10%.
But returns in any given year are all over the place!
Yearly returns have ranged as high as UP 54% and as low as DOWN 43%.
In fact, since 1926 annual returns came within two percentage points of the long-term average in just six of those 97 years. Those are the dark blue bars.
You can see this chart in its entirety here.
These ups and downs are inevitable. Understanding the range of potential outcomes can help you stick with a plan. Staying the course is how investors reapthe stock market’s long-term average.
Note: Large company US stocks such as those in the S&P 500 Index are one component of a well-diversified portfolio. The global stock market also includes smaller companies in the US as well as large and small stocks from outside of the US.
*I do not receive any compensation from Dimensional.